Microarray Quantification
Data Sheet
![]() Shop this product in our online store
Shop this product in our online store
Arrayit | ImaGene 9.0 quantification software microarray analysis gene expression genotyping life sciences research
Tools - Microarray Software - Imagene® 9.0 Microarray Quantification and Analysis Software for Powerful Automated Microarray Image Quantification and Normalization

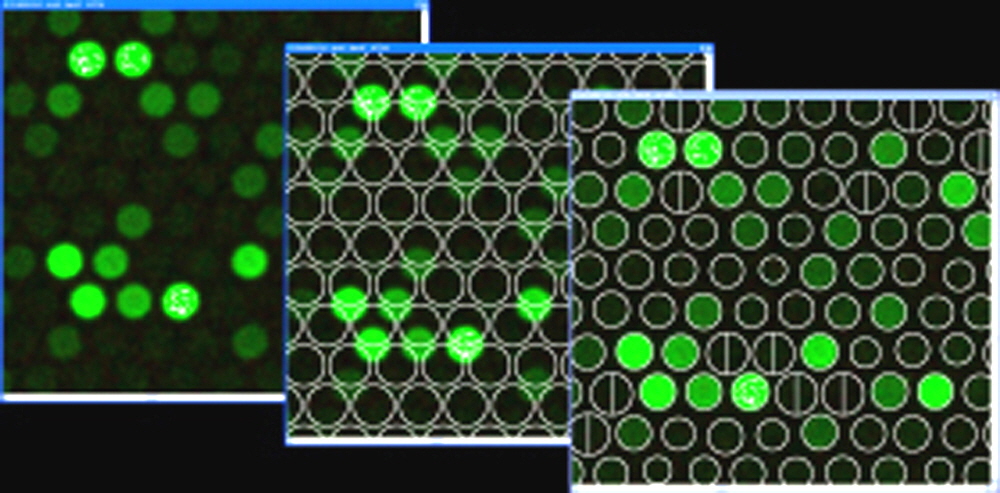
ImaGene® 9.0 is the leading-edge microarray analysis software that offers optimal performance with the broadest and most refined features available today. Through proprietary machine vision technology, ImaGene® 9.0 delivers the highest quality data and most powerful automation to quantify, normalize and analyze your experiments regardless of your microarray type (protein or DNA) or platform. Patented superior spot finding technology and segmentation and contamination removal algorithm ensure optimal performance.
Utilizing patented algorithms and processes, ImaGene® 9.0 provides the most reliable data for your microarray experiments. And, the easy to use software interface and elegant navigation makes it a snap to learn and become productive. With just a few mouse clicks, ImaGene® can quantify, normalize and analyze your microarray experiments.
ImaGene® 9.0 and our complementary modules for expression analysis and aCGH analysis enable the broadest and most refined microarray data analysis. It's time to take a closer look at the pioneering and most advanced microarray analysis software used by leading labs from around the globe for over ten years - ImaGene® 9.0.
Cutting Edge Features - Optimal Results
ImaGene® 9.0 offers the latest and most advanced features allowing you to rapidly explore the data from your microarray experiments with the highest level of confidence in its integrity.
Most Advanced Automation
- Spot Finding & Grid Placement - patented and efficient algorithms automatically thread a grid through each data point, performing thousands of calculations per second ensuring optimal placement and alignment.
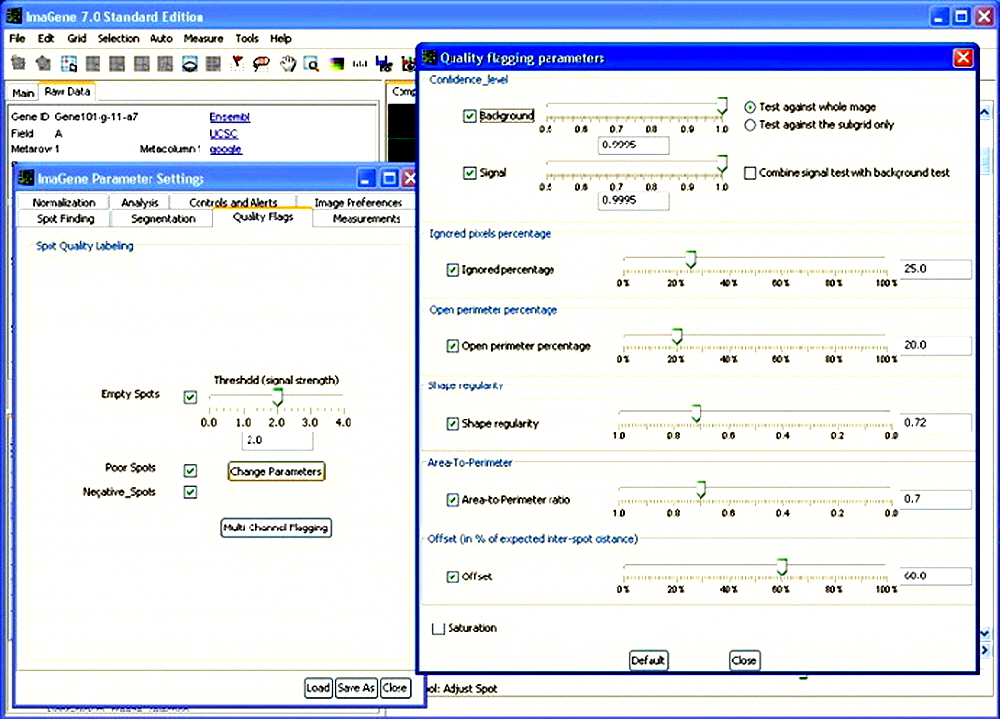
- · Spot & Array-Level Quality Control - ImaGene® 9.0 will automatically analyze every spot and the array itself to determine the quality of the array image or individual spots, minimizing the need for laborious manual inspection of tens of thousands of spots, allowing users to have confidence in the reported measurements.
Highest Quantification Accuracy
- Patented Automated Segmentation - proprietary algorithms and processes are used to automate a precise segmentation process, discriminating between signal, background and contamination, ensuring the highest quality experimental data. This unique feature can even salvage contaminated spots by automatically removing artifacts that statistically do not match the signal or background intensity profiles.
One-Button Batch Processing
- The optional batch-processing module enables rapid, completely hands-free processing of any number of images. This easy to use feature brings new efficiency to high-throughput environments where large numbers of arrays are processed each day. And, to keep check on workflow, an intuitive progress window shows you where you are along the way.
Elegant Interface and Navigation
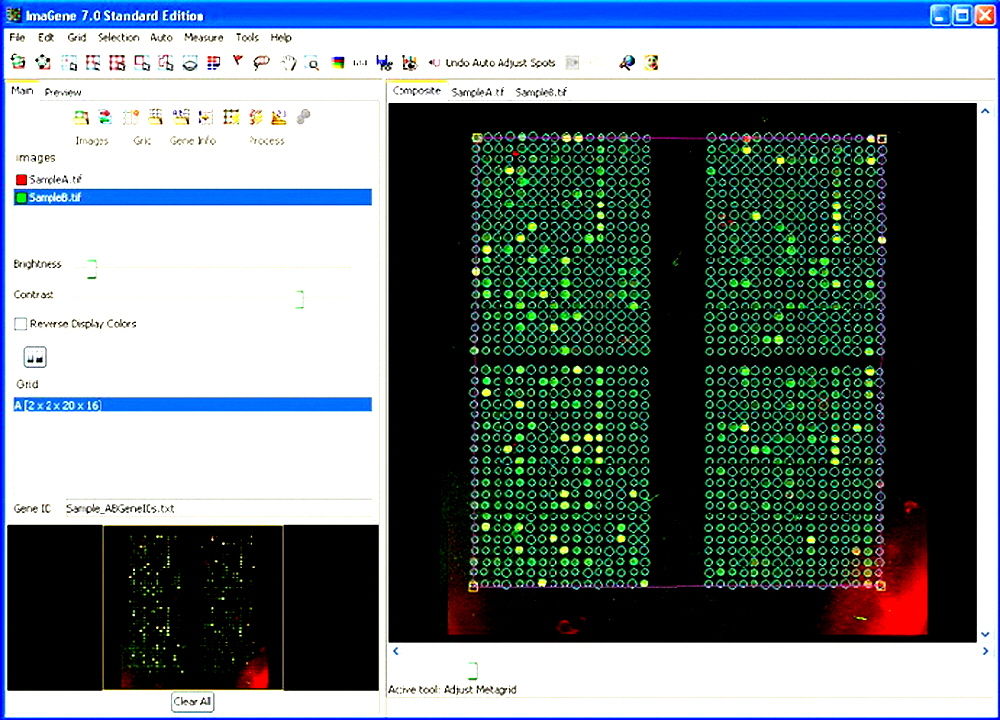
- Easy to learn and use - ImaGene® 9.0 continues a tradition of an intuitive design that is easy to learn to use and is similarly easy to navigate. With tabular formats and sliders, creating and managing settings is as simple as a click of a mouse.
- Interactive and integrated - with interactive and integrated tabular and graphical data views, ImaGene® makes it is easy for you to see the correlations between images and related data with a wide variety of interactive plots (histogram, box, scatter, GenePie and M-A plots).
Analysis Modules
- Flexible options in ImaGene® 9.0 can provide: multiple data normalization options including lowess on entire array; sub-grid or control spots; differential regulation analysis and visualization using Nexus Expression-Lite; and statistical aCGH analysis and visualization using Nexus Solo.
System Compatibility
- ImaGene® 9.0 is platform independent as it is available for Windows, MAC and Linux operating systems; is compatible with broad variety of microarray types (staggered/orange packing, protein, aCGH, etc.) from a large number of manufacturers as well as home spotted arrays.
Additional Features
- Highly flexible in providing automated features requiring limited user interaction and manual features for asserting more user control when needed.
- Scanner independent – works with all scanners including Tecan, Agilent, GenePix (Axon), Perkin Elmer, Innopysis, and more.
- Ready to use templates for many commercial arrays including, Arrayit H25K, Agilent 244K, 4x44K, 44K arrays and Exiqon's miRCURY LNA™ microRNA Arrays and others.
NEW in ImaGene ® 9.0
- NEW in ImaGene ® 9.0 The new and improved features in ImaGene® 9 offer substantial performance improvement and higher quality allowing you to get to the results even faster.
- Improved memory for efficient loading and processing of the latest high density arrays (e.g. 1M probes).
- A consolidated and streamlined new grid format containing both grid structure and GeneID information.
- A new design focused on core image quantification and visualization removing downstream analysis tools.
- Ability to add optional modules for further analysis of gene/miRNA expression (Nexus Expression™-Lite) and CGH analysis (Nexus Solo™).

Figure 2. Easy to use graphical user interface.
System Requirements
Platforms Supported: Windows Win2k/WinXP/Win7, OSX
Minimum: 1.0 GHz Pentium or G4, 512 MB RAM
Recommended: 2.0 GHz or faster Core 2 Duo, 1024 or more MB RAM
ImaGene ® Full Feature List
Image Analysis
- Any array: glass, filter, membrane, custom, or commercial - templates available for over 40 commercial arrays
- Any scanning device, any grid format, any number of spots - Including: Arrayit Innoscan, SpotWare, GenePix, Agilent, Tecan, Roche Nimblegen and more
- Completely Interactive User Interface
- The most advanced image segmentation algorithms for contamination removal
- Rapid quantification processing time for large arrays
- Background correction and data normalization capability
- Differential Regulation Analysis
- Experiment/control and multi-replicate experimental design
- Multiple channel capability 1, 2, 3, and 4 color channel compatible
- One-touch contrast/brightness adjustment
- Support for annotations
- Saturation Detection
- Simple and flexible GeneID file column format requirements
- Measurement cleansing and normalization tools
- OS independent - Windows, MAC, Linux
- Automated Quality Control with Automatic Flagging
- Manual spot flagging
- Customizable logic for combining flags from multiple channels
- Ability to reload and review existing quantifications
- Intuitive multi-spot selection engine for interactive spot analysis throughout plots, measurement table, image and segmentation preview
- Ability to highlight gene IDs imported from a file as a control type
- GAL , MAGE-ML import/export for array template info (including batch mode)
- File formats can be exported in XML and text-based formats
- Support for TIFF and other popular scanner image formats
- One-click access to customer support center on our web site
- Integrated screen capture

Figure 3. Advanced Quality Control Parameters.
Data Analysis
- Integrated data visualization tools in the core ImaGene® application for quality, trend and regulation assessment
- M-A, histogram, box, scatter and GenePie Plots
Optional
- aCGH analysis and visualization module
- Gene regulation analysis and visualization module
- One-Button batch automation module
Get Started Today
Contact us today for a free trial of ImaGene® 9.0, to upgrade from your current ImaGene® software, or for technical information by electronic mail (arrayit@arrayit.com) or email arrayit@arrayit.com.

