SpotLight™ Two-Color and SpotLight™ Turbo Six-Color Microarray Fluorescence Scanners
Data Sheet
![]() Shop this product in our online store
Shop this product in our online store
Arrayit SpotLight™ Two-Color Microarray Scanners provide the market’s most affordable solutions for high-quality fluorescence scanning. SpotLight™ leverages new “cool” excitation technology, sensitive deep-space imaging detectors, proprietary high numerical aperture lenses and custom filter sets to capture more signal than traditional microarray scanners, while offering reduced background and photobleaching. Arrayit sets a new standard in microarray scanning with the 2-color SpotLight™ cyanine 3 and cyanine 5 microarray scanners and custom scanners including SpotLight™ Blue for FITC scanning. An Arrayit BioBlue Mini Computer and flat panel display are included with all systems.
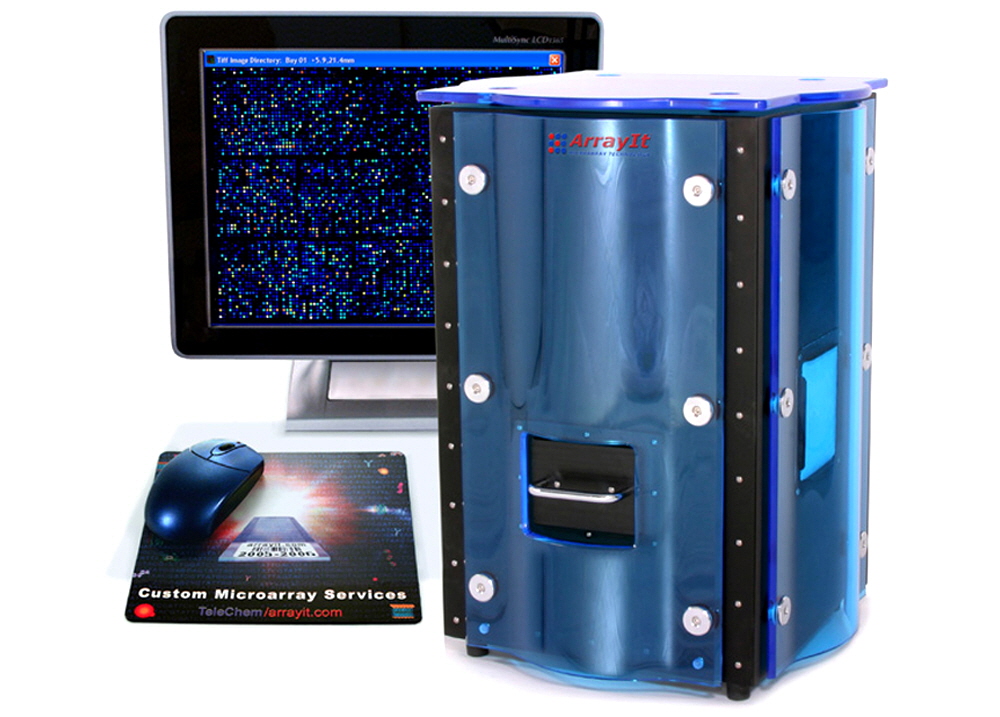
New! SpotLight™ 2 now available!
Arrayit SpotLight™ Two-Color Microarray Scanners provide the market’s most affordable solutions for high-quality fluorescence scanning. SpotLight™ leverages new “cool” excitation technology, sensitive deep-space imaging detectors, proprietary high numerical aperture lenses and custom filter sets to capture more signal than traditional microarray scanners, while offering reduced background and photobleaching. Arrayit sets a new standard in microarray scanning with the 2-color SpotLight™ cyanine 3 and cyanine 5 microarray scanners and custom scanners including SpotLight™ Blue for FITC scanning. An Arrayit BioBlue Mini Computer and flat panel display are included with all systems.
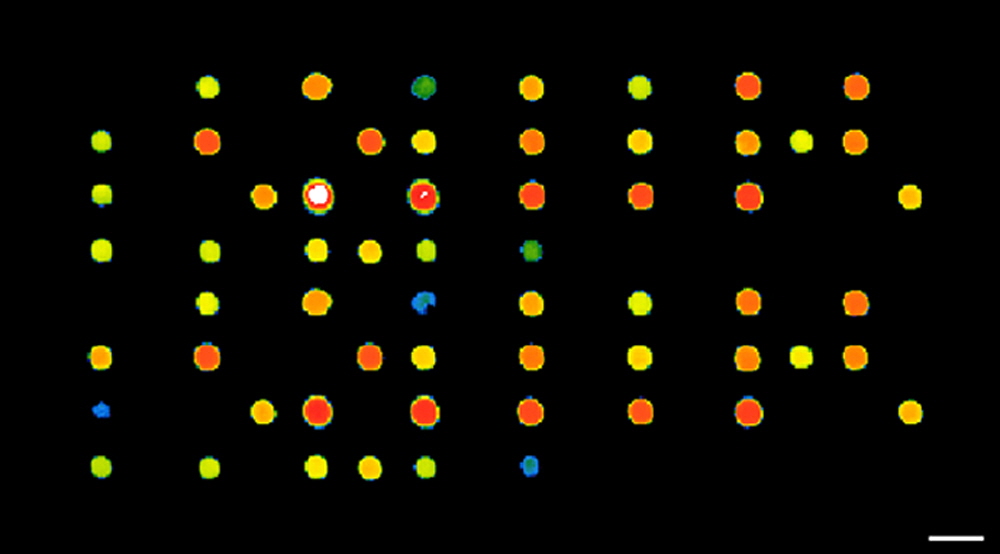
Figure 1. Human P450 genotyping (DrugMet) microarray scanned in the green (cyanine 3) channel using a SpotLight Microarray Scanner at 10 µm resolution. Total imaging time was 8 seconds. The signal to background ratio is approximately 3,000:1. The 16-bit data are coded to a rainbow color palette and the space bar corresponds to 250 µm.
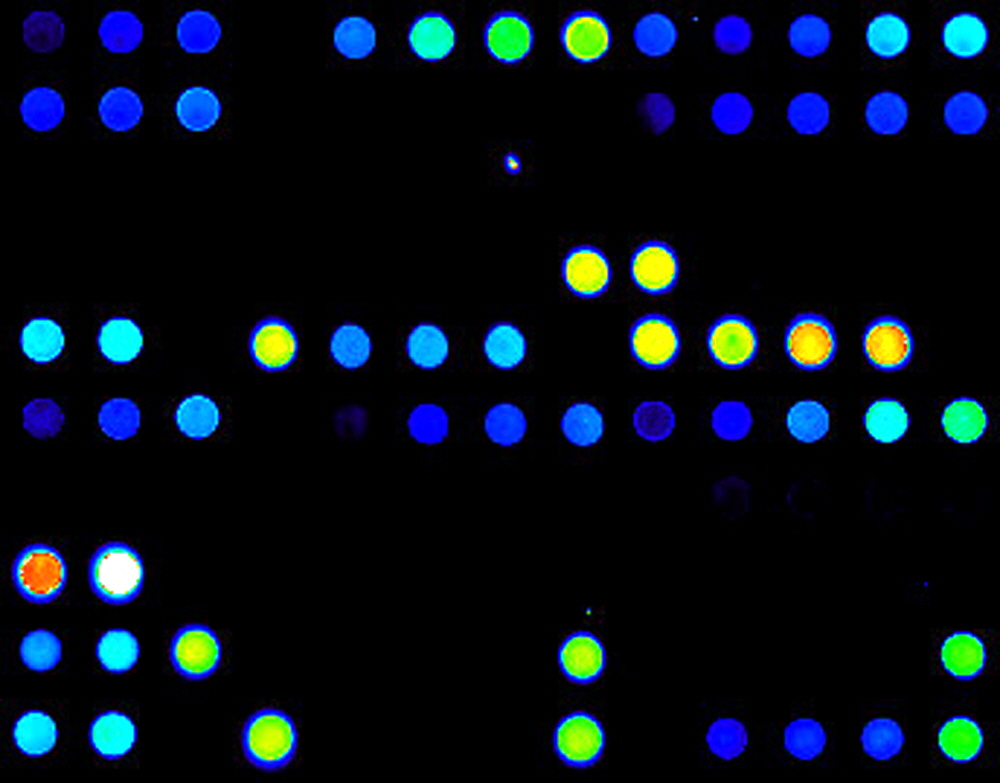
Figure 2. FITC protein microarray scan.
Product Description
- Instrument type: microarray scanner
- Number of channels: 2-color and 6-color (Turbo)
- Format: standard glass slide 25 x 76 mm (1 x 3")
- Sensitivity: 0.1 fluors per square micron and 1,000 fluors per spot
- Signal-to-background of up to 10X higher than some commercial scanners
- Scan all types slide based microarrays
- Compatible with all types of surface chemistries including glass, plastic, hydrogels, nitrocellulose and nylon.
- Resolution: 10 µm
- Single image scan size: 1392 x 1024 pixels
- Single image file size: 2.7 MB
- Maximum scan area: 25 x 76 mm
- File format output: Standard 16 bit TIFF (0-65,536)
- Dynamic Range: >10,000-fold
- Software requirements: Win 2000, Win XP
- Computer Hardware requirements: P IV-2.0 GHz, 256 megs RAM, 20 GB drive
- Standard detection wavelengths: Cy3 (532 nm) and Cy5 (635 nm)
- Optional detection wavelengths: 455 nm, 470 nm, 488 nm, 505 nm, 590 nm, 617 nm, 625 nm and white light
- Standard filter sets: optimized for Cy3 and Cy5
- SpotLight™ Blue offers market’s most affordable FITC scanner
- Optional filter sets: fluorescein and fluorescein analogs, TRITC (Rhodamine), APC, ethidium bromide, Alexa dyes, and several GFP variants
- Standard detection label: fluorescent
- Optional detection labels: chemilluminscent and colorimetric
- SpotLight™ size (L x W x H): 34 x 36 x 49 cm (13.25 x 14.25 x 19.4 in)
- SpotLight™ Turbo size (L x W x H): 30 x 46 x 46 cm (17.5 x 14.25 x 19.4 in)
- SpotLight™ weight: 18.7 kg (41.4 lbs)
- SpotLight™ Turbo weight: 21 kg (46.2 lbs)
- Energy consumption: low
- Heat emission: low
- Electrical requirements: 100 or 240 Vac and 50-60 Hz
Product Components
- SpotLight™ Personal Two-Color Fluorescence Microarray Scanner
- Power supply with Voltage-Appropriate Power Cable
- High-Speed Firewire Cable
- High-Speed USB Cable
- High-Speed Ethernet Cable
- Arrayit BioBlue High-Speed Personal Computer
- SpotLight™ Controller Software (Pre-Loaded on Computer)
- SpotLight™ Flat Panel Display with Monitor Cable and Power Cord
- Computer Power Cord with Voltage-Appropriate Connector
- Computer Keyboard
- Computer Mouse
- Computer Mouse Pad
- Microarray for Test Scanning
Short Protocol
1. Configure SpotLight™ Personal Microarray Scanner, computer and monitor.
2. Power up components.
3. Launch SpotLight™ Control Application.
4. Carefully insert a microarray into the SpotLight™ substrate holder.
5. Perform a Pre-Scan.
6. Perform a Final Scan.
7. Adjust the Gain Setting and save the TIFF files.
8. Perform data analysis.
Complete Protocol
1. Configure SpotLight™ Personal Microarray Scanner, computer and monitor. Carefully unpack each SpotLight™ component and check each item on the SpotLight™ Shipping and Receiving Checklist to make sure each component has been received. Place the components on a stable laboratory bench and connect the cables and power cords to the appropriate component. The SpotLight™ Scanner should be fitted on the back of the instrument panel with a power supply (small black box with cables attached to each end) , a USB cable, and a firewire cable. The Arrayit BioBlue High-Speed Personal Computer should be fitted with a USB cable (connected to the SpotLight™ Scanner), a firewire cable (connected to the SpotLight™ Scanner), an ethernet cable (inserted into an Internet wall jack), a VGA monitor cable (connected to the flat panel display), and PS/2-USB cables (connected to the computer keyboard and mouse). All connections to the BioBlue Computer should be made to the back of the instrument panel. The SpotLight™ Scanner, Computer and Flat Panel Display should be fitted with power cords. Fit the power cords into the back of each instrument panel and insert each cord into an appropriate electrical socket (110 volt for domestic instruments and 220 volt for most overseas instruments). All cables and cords should lie naturally behind each instrument and should be free or kinks and tension. Thumb screws should be tightened completely on thumb-screw containing connections.
2. Power up components. Turn on the power switches for the SpotLight™ Scanner, Computer and Flat Panel Display. The SpotLight™ Scanner power switch is located on the side of the power supply (small black box with two cables on either end). The power switch for the Arrayit BioBlue Computer is located on the front side of the computer instrument panel. The power switch for the Flat Panel Display is located beneath the display screen on the instrument panel. When all three components are connected and powered properly, the Computer desktop images including the SpotLight™ Scanner software shortcut should appear on the Flat Panel Display. The SpotLight™ Scanner and BioBlue Computer cooling fans should be audible above background noise.
3. Launch SpotLight™ Control Application. Double-click on the SpotLight™ software icon located on the left side of the desktop on the Flat Panel Display. The software will ask for system registration prior to operation. Follow the registration instructions carefully. Once your SpotLight™ Scanner is registered it is ready for operation. Launching the SpotLight™ Control Application prompts the auto-calibration process, which takes a few minutes. Please be patient while the SpotLight™ Scanner completes the auto-calibration process.
4. Carefully insert a microarray into the SpotLight™ substrate holder. Following auto-calibration, the substrate holder automatically moves forward into the load position to accept a glass substrate slide. The SpotLight™ Scanner accepts any standard glass substrate slide (25 x 76 x 1 mm). The substrate loading bay is illuminated brightly with a white light source to aid in substrate loading. Carefully insert a substrate slide into the holder such that the right and left edges of the glass are held firmly by the substrate locator rails. Arrayit provides a bar-coded H25K microarray (or equivalent) for test scanning. The microarray substrate should insert snugly into the holder until it reaches the holder end. A correctly held substrate will appear level in the holder and inserted about 50 mm into the instrument, with the bar-code end protruding outside the instrument case. Substrate loading takes some practice. Make sure that the loading bay is illuminated at all times during the substrate loading process. The substrate illuminator can be turned on at any time using the “Illuminate Load Position” button located on the right side of the SpotLight™ Control Application menu bar. Do not attempt to scan an improperly loaded substrate as this may cause the substrate to drop inside the scanner case.
5. Perform a Pre-Scan. Click on the “Pre-Scan” button located on the left side of the SpotLight™ Control Application menu bar. Opening the Pre-Scan routine prompts the user to select the Green (540 nm) or Red (640 nm) channel. Click on the desired scanning channel (Green or Red) and allow the Pre-Scan process to proceed. Initiating the Pre-Scan process causes the substrate holder and substrate to retract inside the scanner. Once the substrate retracts (10-15 secs), close the magnetic scanner door to create a light-tight environment during the Pre-Scan. Pre-Scanning produces 1392 x 1024 pixel (1 square centimeter) tiled images from left to right and top to bottom across the entire 25 x 76 mm microarray surface over a period of several minutes. If the region of interest is located in the top or middle portion of the glass substrate slide, the Pre-Scan process may be halted at any time by clicking on the sofware prompt located within the SpotLight™ Control Application. Pre-Scan data will appear much less intense than Final Scan data so do not judge image quality or signal intensity based on Pre-Scan data.
6. Perform a Final Scan. The 1392 x 1024 pixel (1 square centimeter) Final Scan region will appear as green thin-lined rectangle located over the Pre-Scan data. Use the computer mouse to position the scanning window into the desired scanning location. Once the scanning window is positioned properly, click on the “Final Scan” button located on the left side of the SpotLight™ Control Application menu bar to initiate the Final Scan process. Please be patient during Final Scan as this process takes several minutes to complete. A Final Scan image will appear in the SpotLight™ Control Application software window.
7. Adjust the Gain Setting and save the TIFF files. The 1392 x 1024 pixel (1 square centimeter) Final Scan data image can be intensity-adjusted using the Gain Setting slider located on the right side of the Final Scan software window. Once the desired Gain Setting is obtained, click “Save” to save the TIFF image on the Computer hard drive. Users may Gain Adjust and save as many Final Scan TIFF images as desired from a single Final Scan image. Once each TIFF image has been saved, click “Done” to complete the final scan process or to return to “Pre-Scan” to select a different scanning channel or scan region. The file size of a 1392 x 1024 pixel (1 square centimeter) Final Scan data image at 10 µm resolution is 2.7 MB per TIFF.
8. Perform data analysis. SpotLight™ Scanner TIFF images are saved in standard 16-bit format compatible with every major brand of microarray quantification and data analysis software. Use quantification software to calculate spot signal intensities and data analysis packages to generate clustering, principle components, and other types of analyses.
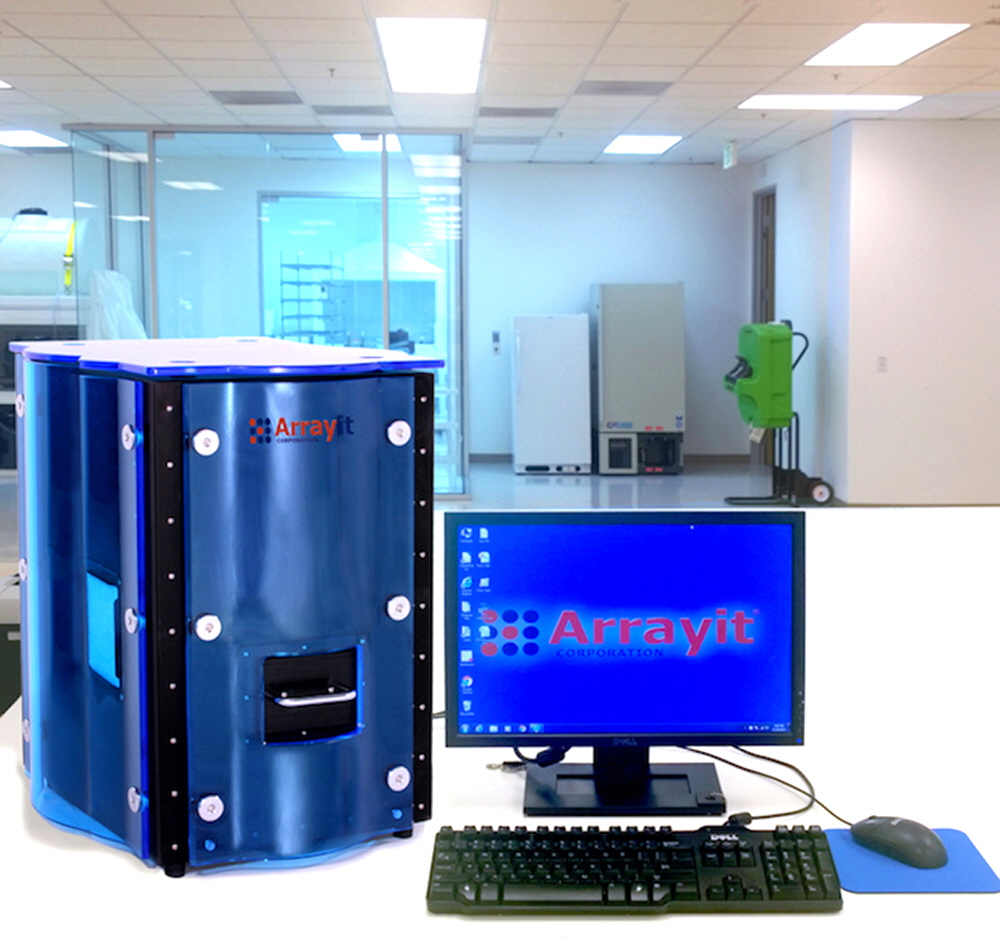
Figure 3. Arrayit SpotLight™ Turbo Six Color Microarray Scanner.
